Germany

Analyzing Land Cover Correlation and Population Exposure to Air Pollutants
Geographic Information Systems Lab Project
Academic Year 2024/25 - Politecnico di Milano

Project Overview

This project harnesses free and open geospatial data from the Copernicus programme to study historical trends of air pollutants in relation to environmental variables and evaluate exceedance above recommended health guidelines. Using CAMS (Copernicus Atmosphere Monitoring Service) reanalysis data from 2013-2022, we analyze the spatial distribution and temporal trends of major air pollutants.

Data Sources

  • CAMS European Air Quality Reanalysis - Hourly pollutant data (2013-2022)
  • ESA CCI Land Cover - Multi-temporal land cover maps
  • WorldPop - Population count data (2020)
  • FAO GAUL - Administrative boundaries

Health Guidelines

Pollutant EU Annual Limit WHO AQG
NO₂ 40 μg/m³ 10 μg/m³
PM2.5 25 μg/m³ 5 μg/m³
PM10 40 μg/m³ 15 μg/m³
NO2 Concentration Map

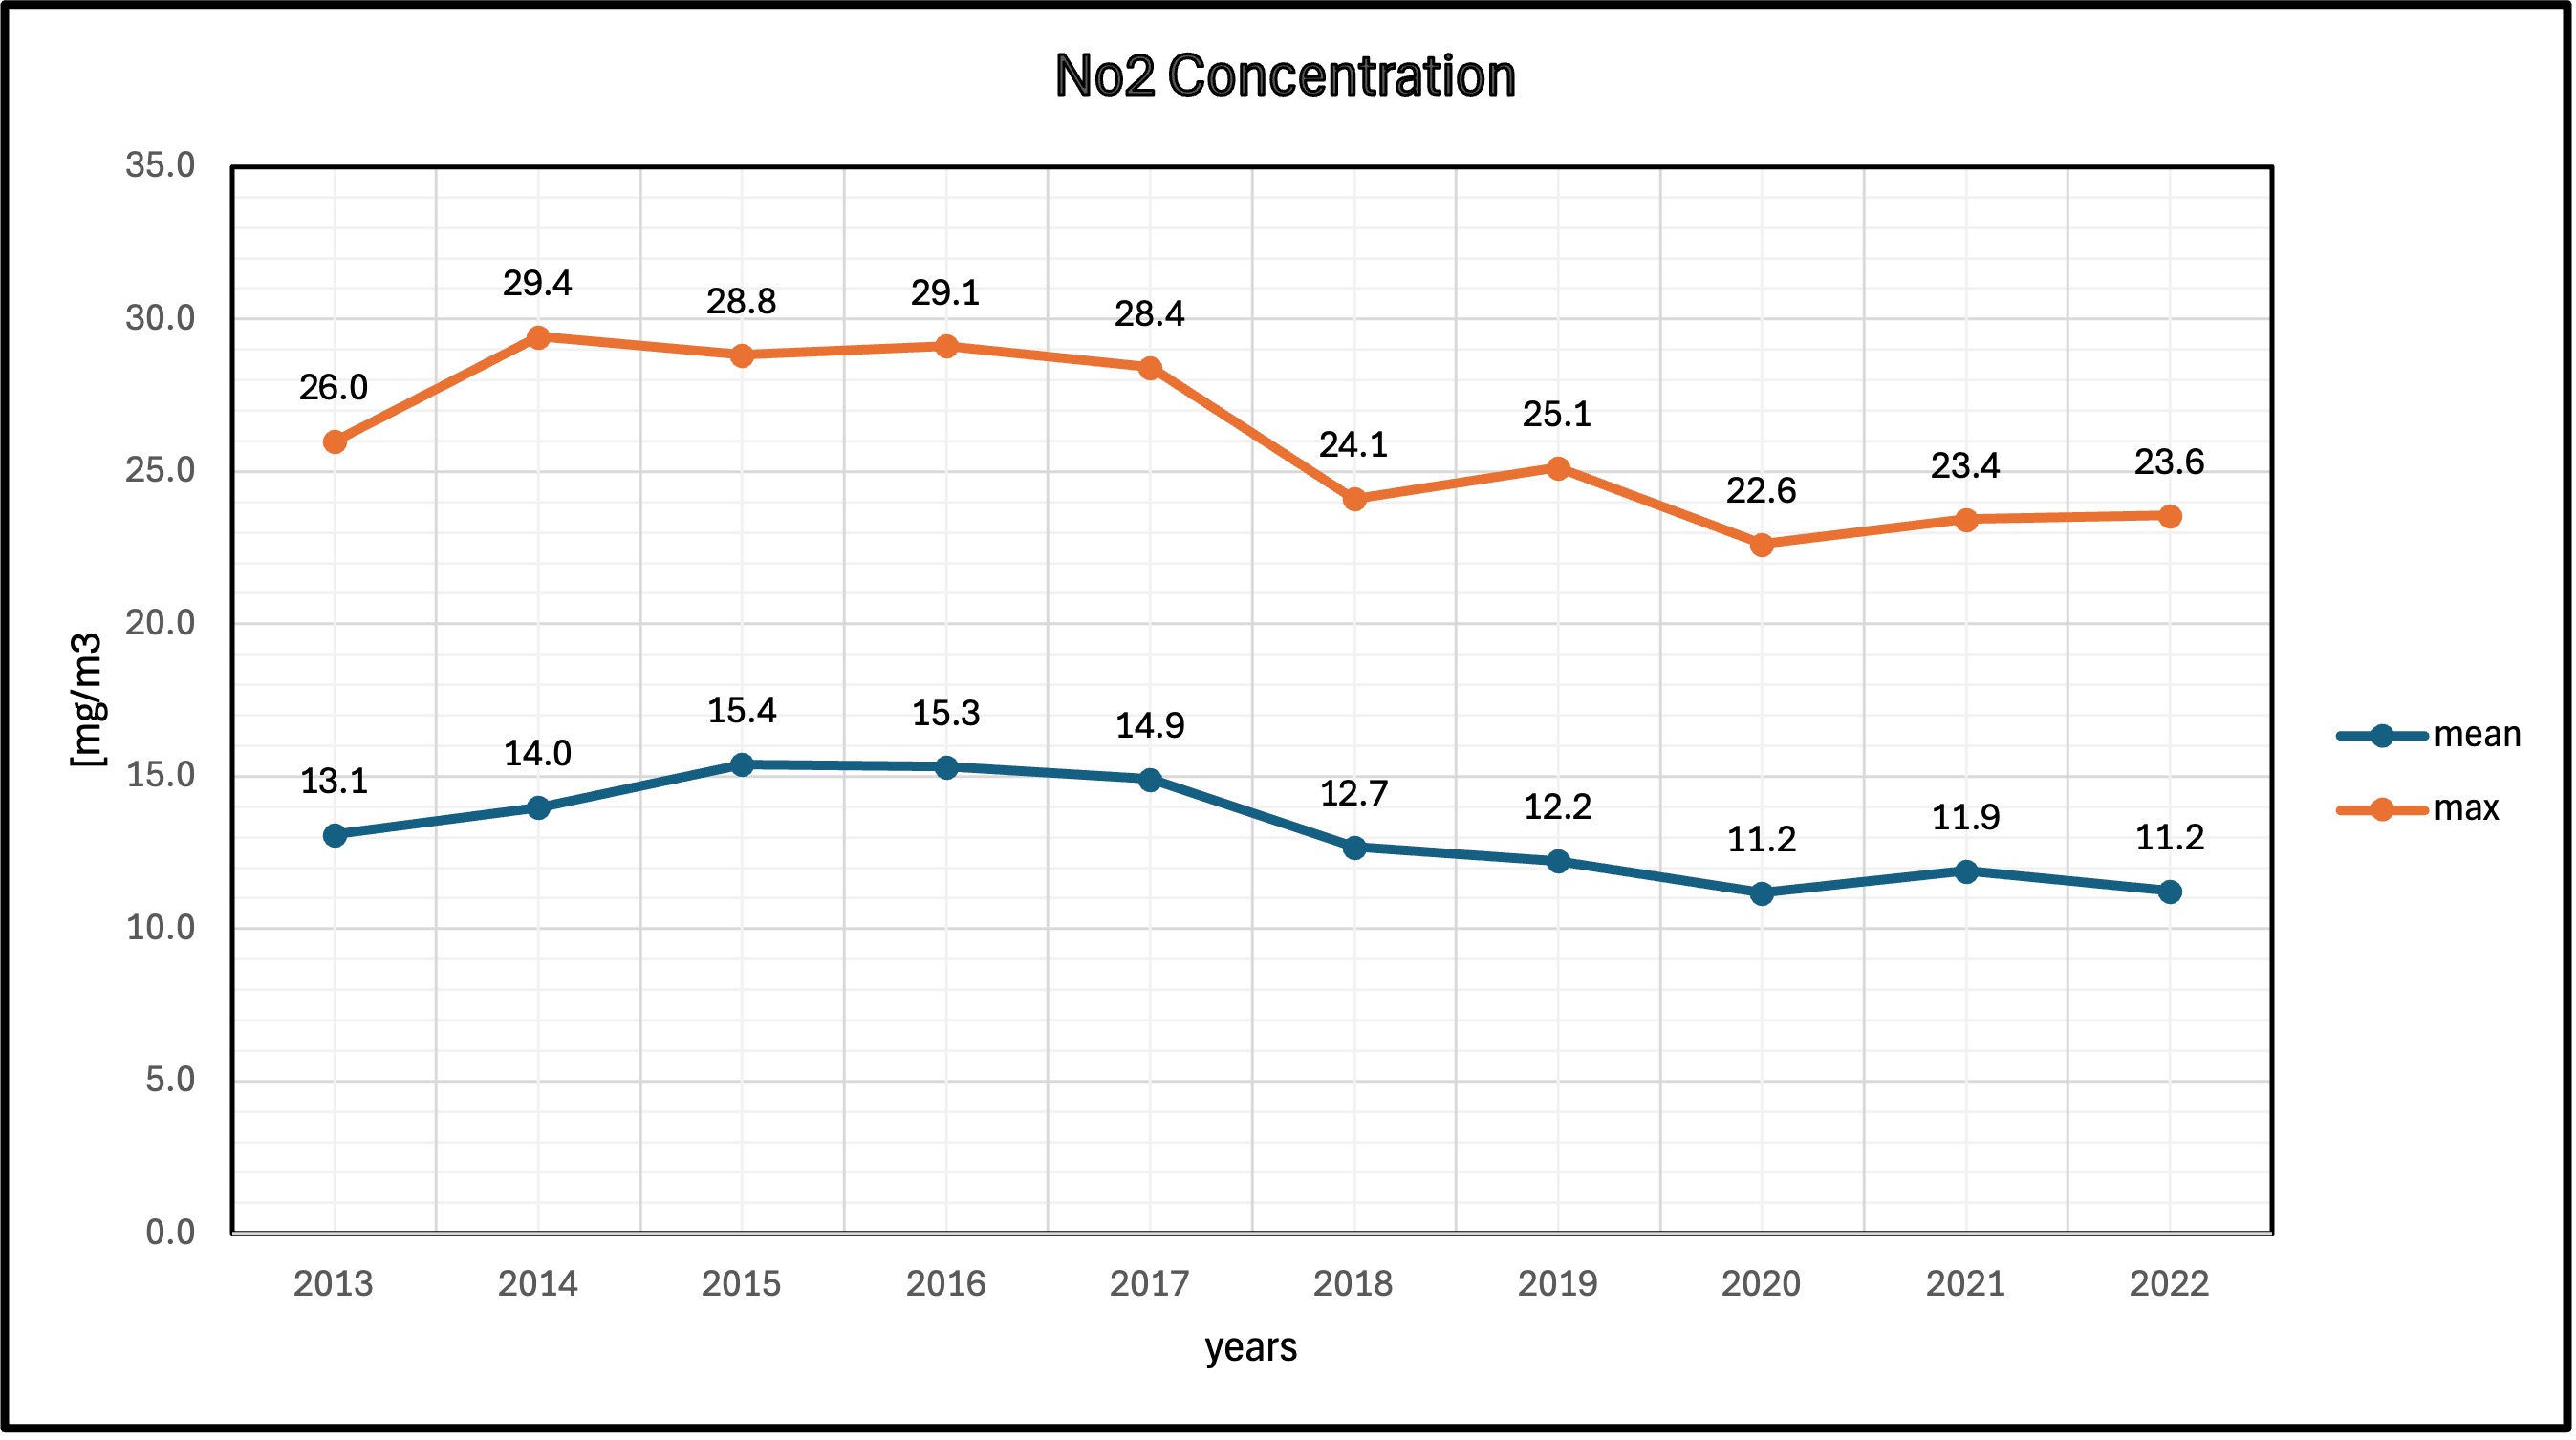
Nitrogen Dioxide (NO₂)

Primary air pollutant mainly from vehicle emissions and industrial activities. NO₂ contributes to respiratory problems and is a precursor to ground-level ozone formation. Our analysis covers concentration patterns, land cover correlations, and population exposure across the study area.

PM2.5 Concentration Map

Fine Particulate Matter (PM2.5)

Particles with diameter ≤ 2.5 micrometers that can penetrate deep into lungs and bloodstream. PM2.5 is linked to cardiovascular diseases, respiratory issues, and premature mortality. We analyze its distribution patterns and relationship with urban development.

PM10 Concentration Map

Coarse Particulate Matter (PM10)

Particles with diameter ≤ 10 micrometers from various sources including dust, pollen, and combustion. PM10 affects the respiratory system and visibility. Our study examines seasonal variations and correlations with different land cover types.

Methodology

Our analysis employs standard GIS techniques for data preprocessing, processing, and advanced visualization. The workflow includes temporal aggregation, spatial analysis, and bivariate mapping to reveal relationships between air quality, land cover, and population exposure.

Data Acquisition

Downloaded CAMS NetCDF files, ESA CCI land cover maps, and WorldPop population data for the study period 2013-2022.

Temporal Aggregation

Processed hourly data to monthly and annual averages using QGIS mesh calculator and raster processing tools.

Spatial Analysis

Conducted zonal statistics, land cover reclassification, and bivariate mapping to analyze pollutant-environment relationships.

Population Exposure

Assessed population exposure to different pollutant concentration levels using health guideline classifications.

Trend Analysis

Analyzed 2013-2022 time series data to identify long-term trends and annual average differences from 5-year means.

Visualization

Created bivariate maps, concentration classifications, and interactive charts for effective communication of results.

Interactive WebGIS

Explore our interactive web mapping application built with GeoServer and OpenLayers. The WebGIS provides dynamic visualization of pollutant concentrations, bivariate maps, and temporal analysis tools.

Features

  • Interactive pollutant concentration maps
  • Bivariate mapping (pollution vs population)
  • Temporal slider for time series analysis
  • Layer switching and transparency controls
  • Population exposure charts
  • Administrative boundary overlays

Technical Stack

  • GeoServer - Web map server
  • OpenLayers - Interactive mapping library
  • QGIS - Data processing and styling
  • DataPlotly - Chart generation

Research Team

This project was developed as part of the Geographic Information Systems course at Politecnico di Milano, Academic Year 2024/25.

Team Member 1

Gianluca Bettoni

Responsible for PM10 data processing and analysis throughout the project workflow.

Team Member 2

Alessia Ippolito

Responsible for PM2.5 data processing and analysis throughout the project workflow.

Team Member 3

Edoardo Pessina

Responsible for NO2 data processing and analysis throughout the project workflow.